Step into a specific call when debugging in Visual Studio
Last week, as we were wrapping the first day of .NET Developer Days conference, I was sitting in the “Ask The Expert” area quietly by myself, reading the poems, waiting for questions with Kendra Havens chatting about Visual Studio shortcuts and enjoying the pre-party beer. As it turned out, there’s one super handy shortcut for debugging that most people – Kendra included 😉 – are not aware of (and which I wasn’t able to cover in my 60 minutes of allotted time). Thus, I must spread the word.
Let’s imagine you have this code.
static void Main(string[] args)
{
	Foo(Bar(), Baz());
}

static void Foo(int a, int b)
{ }

static int Bar() => 1;

static int Baz() => 2;
And the debugger is on the Foo(Bar(), Baz()) statement. Now if you want to step into Foo function, you probably press F11 (please don’t say you’d use the button on the toolbar…). But that will jump into the Bar function. If you’re bit shortcut-geeky, you’d press Shift-F11 to jump out of it and then continue doing the same with Baz. Not bad. But there’s a better way.
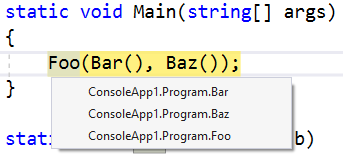
Let’s enter Alt-Shift-F11 world. Pressing this key combination is going to give you menu (at the location where your mouse is) with functions (or properties, etc.) that you can step into (in the order of calling) and you can directly select (using arrow keys, obviously 😉) the function you’re interested in, skipping the rest.

Isn’t that great little hidden nugget? I use that quite often and it saved me plenty of time, especially when the calls are nested a lot (which I consider fine if it doesn’t hurt readability). Did you know about it? Let me know in the comments.

